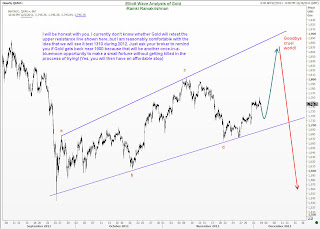
But beware of paying too much attention to the very short term charts! I have often warned you in this blog, (and if I remember correctly, also in my book “Five Wave to Financial Fortune”) that you can make decent money by trading the bigger waves. So what is my take in the bigger picture?
Elliott Wave analysis of the loger term Gold charts tells me that there is a reasonable chance for us to go dramatically lower, say to around 1310 during 2012. You should therefore start making plans to identify a good, low-risk selling level to capture that huge move (if and) when it happens. Of course, I hope to be around to give you my two cents worth at that time, but today’s Elliott Wave comments on Gold’s outlook is laying the foundation for that move. Just remember that you read it here first, and when others pick up the ideas and publish it, you know that they are also secret members of the Wave Times club!
Enjoy.
Credit: RAMKI

Comments are copy pasted for blog referred to above and are of respective authors.
ReplyDeleteRamki,
From July 1999 bottom (@250), wave 1 of impulse wave III started and could have ended in March 2008 @ 1030, and wave 3 would have ended @ 1920 (1.618 of wave 1) in September 2011.
The sub-waves within wave 3 have wave (1 – 1005) and (3 – 1225) being equal and wave (5 – 1920) is of 1.618 of (1 thru 3).
So, that leads me to believe that the current wave structure is the fourth wave (of III). However, I think this will most likely be a deep correction (since wave 2 is only 38.2% of wave 1).
Since wave 2 (ending @ 680) was a double zigzag, I expect the fourth wave to be either a flat or, simple zigzag. It could most likely be a flat, but it will start with a zigzag and then move up I believe.
Primary:
If the first leg of the zigzag has already finished (assuming the analysis is correct), the probability of Gold breaking below 1400 is very high. If the c wave of flat fourth wave may have just started, it could go very well reach 1200 in 2012 before moving up and down to form the flat (like a sideways cone).
Alternate:
If the flat fourth wave starts without the zigzag, then Gold would reach 1900 easily before moving down and up and down to form the flat for the next two years.
Final thoughts:
This analysis would fail very badly if Gold moves beyond 1865. And I might have to take up Golf as my other source of income.
Cheers
Naga
Hello Naga, What you are saying is perfectly possible, and indeed, my latest post has taken that into consideration. That approach will have the 4th wave already finished at 1535, and the current recovery is actually an expanding diagonal triangle as portayed in the chart on Wave Times. So whether it is still part of the 4th wave, or it is an expanding diagonal triangle in the fifth wave, the conclusion is any recovery towards the prior high should be used to turn short in Gold. I have often mentioned in this blog as well as in my book that our wave counts should serve us. We use them till they are useful, and then discard them in favor of a new count when we have to.
Ramki
Hey, nice site you have here! Keep up the excellent work!
ReplyDeleteNifty Trading