Monday, December 5, 2011

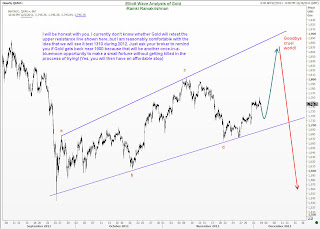
GOLD LONG TERM PERSPECTIVE

But beware of paying too much attention to the very short term charts! I have often warned you in this blog, (and if I remember correctly, also in my book “Five Wave to Financial Fortune”) that you can make decent money by trading the bigger waves. So what is my take in the bigger picture?
Elliott Wave analysis of the loger term Gold charts tells me that there is a reasonable chance for us to go dramatically lower, say to around 1310 during 2012. You should therefore start making plans to identify a good, low-risk selling level to capture that huge move (if and) when it happens. Of course, I hope to be around to give you my two cents worth at that time, but today’s Elliott Wave comments on Gold’s outlook is laying the foundation for that move. Just remember that you read it here first, and when others pick up the ideas and publish it, you know that they are also secret members of the Wave Times club!
Enjoy.

Credit:  RAMKI

Tuesday, October 25, 2011

GRAND SUPERCYCLES, SUPERCYCLES AND CYCLE WAVES

On wednesday, after a careful historical review, we posted the following:
Now that markets worldwide have declined anywhere from 22% (SPX/FTSE) to 43% (RTSI), we thought we would review the current market and place it into the proper historical perspective. In February 2010 we published this piece on the GSC: http://caldaro.wordpress.com/2010/02/14/grand-super-cycle-revisited%e2%80%8f/. We see no reason to change this view.

A quick recap. A multi-century Grand Supercycle topped in 1929 and ended with the Great depression and an 89% stock market collapse by 1932. After that a new multi-century GSC began. Each GSC bull market consists of five SuperCycle waves. The bull market SC’s are multi-decade events. The first of these SC bull markets ran from 1932-2007. This we labeled SC1. The two year bear market that followed, when the market lost over 55% of its value, we labeled SC2. At the March 2009, SPX 667 low, SuperCycle 3 began its multi-decade bull market. Notice the bear markets cycles take very little time to do major damage, i.e. 1929-1932 89% market loss, and 2007-2009 55% market loss.

Each SuperCycle bull market consists of five Cycle waves. During SC1, 1932-2007, the bull market Cycle waves lasted from five years (1932-1937) to 31 years (1942-1973) and 33 years (1974-2007). Notice the shortest was five years. Within each bull market Cycle wave there are five Primary waves. These Primary waves can last anywhere from two months (Jly32-Sept32) and five months (Feb33-July33), to 17 (1949-1966) and 18 years (1982-2000). You may already see where I’m heading with this.
When we review the 15 world market indices we track we find 9 have OEW confirmed bear markets, and the rest came close to confirming at the recent lows. The wave counts for their previous bull markets display seven with Primary wave I highs, followed by a Primary II bear market. The other eight display five wave structures, counted as a completed Cycle wave [1] into their bull market high, and then their bear markets. When we compare the historical bull market time relationships of Cycle waves (5 to 33 years) and Primary waves (2 months – 18 years), to these eight 2 year bull markets we find they are historically too short to be counted as completed Cycle waves. They look more like Primary waves. As a result of this analysis, all the world indices must have had a Primary wave I high to end their bull markets and then a Primary wave II bear market. We will be downgrading the current counts, by one degree, on all eight of these world indices. The ramifications of this “project, monitor, adjust” event will prove to be quite interesting. We will cover this at another time.
That time is now. As we continued our analysis, covering 1932-present, we reviewed all Primary waves for the entire period. What we found is quite interesting. Every rising Primary wave I or III, lasting from 5 months to 18 years in the study, was followed by a declining Primary wave II or IV of 1 year to 6 years. The shortest declining Primary wave, (July33-July34), followed the shorter rising Primary wave (Feb33-July33). Since our current Primary wave I lasted 26 months, we’re looking at a Primary wave II of at least 12 months.


 CREDIT:  caldaro
Tuesday, September 20, 2011

DOW JONES INDUSTRIAL


We are witnessing yet another recovery in this complex correction, and so a new key level emerges for our next directional trade. This comes at 11940. If we approach that level with diminishing volume, it makes sense to turn short there with a nearby stop. I still have not given up on the move to 9970 at this point in time.  See chart below:


Credit: Ramki


Thursday, September 15, 2011

Gold –Possible Top out on Long Term Charts

If we look into the long term charts of gold on log scale. 

We have tested the top of the long term channel at 1900-1950.

Every time Gold has touched the higher end of the channel it has ended up correcting 15-20% also over the next few months.
  
If one has to enter I believe a technical entry point comes around 1600-1700 dollars. 

For the traders i would suggest to be careful on short term longs. Below 1770 there could be much sharper correction in gold. One may even look for a short at 1880-1920 zone.

Lets have a look at the daily charts which shows 1770 is an important level.

Although there would be many arguments of Gold being a good hedge to inflation or a great long term story but at current levels one may pause a bit on Gold Buying and if you have not bought gold yet its better not to take exposure to it.

This is purely from a market perspective and from current levels I would at least expect the pace of gold rise will slow down and downside risks seems more higher.

Credit:  Nooresh


Monday, September 5, 2011

Our major objective for Gold, identified in the August 21 Elliott Wave update, remains 2055. However, knowing that we are mere mortals in front of the market, we should seek additional clues along the way. Elliott has some strict rules, and one of them is in an impulse wave, Wave 3 should not overlap the top of Wave 1. As you can see from the attached chart, we are going up as a third wave, and equality measure for the third wave lies exactly at the prior top of 1911. Should Gold fail there for some unexpected reason, and come back and trade below 1835 (the first wave top), then we will say that the prior top was indeed the end of a major move, and what we just saw was a flat correction that unfolded in 3 waves. The implication is Gold will then travel quickly lower. While we stay above 1835, then, we should continue to be optimistic about the possibility of Gold reaching 2055. We shall, of course, fine tune that target as we go higher.

CREDIT:  Ramki

Wednesday, August 31, 2011

WHERE ARE YOU GOING NIFTY

“Qua Vadis” or “Where are you going” NSEI is the question uppermost on traders’ mind in India. Having reached 4800, and wiping away the small time traders (who dared to stick on to their stale longs) by falling briefly to 4711, the index has rallied quite smartly in the last few sessions. But I would like to sound the alarm bells here if you are thinking the worst is over. We should get at least one more dip to test the lows again, potentially even breaking it. There is immediate resistance at today’s high around 5040, and beyond that at 5100/05. Although the prior fourth wave at 5190 area will become a reflex point (read more about the importance of reflex points on my book: Five Waves to Financial Freedom, it is likely we will fail to reach that high. Even if it does, you will see it come down sufficiently to take profits on any shorts you may have at or above 5100. Those who are thinking of buying for the medium term should continue to be patient. Bear market rallies such as these have a habit of abruptly turning around. Good luck.

Credit:  Ramki

Monday, August 22, 2011

ELLIOT WAVE ANALYSIS OF GOLD

As you can see from the chart, we seem to be experiencing an extension in the fifth wave (even though the third wave was also an extended wave). Although Elliott has said that at least one impulse wave will be extended, we have seen several cases of a trend having two extensions. ( we will not quarrel with those who disagree, because what works for us seems to work well!)

Going back to the Gold chart, wave 3 did a 300% projected move of Wave 1. Then we got a brief correction after which the fifth wave took off to the upside again. There was no way anyone could have predicted a second extension.

The next question is are we anywhere near the top? My feeling is we will likely experience a bout of selling around 1895/1925 and witness a quick correction down to 1815 area. But then we will try one more time to go up. That final push may well take us to around 2055, but as of now, I would urge you to be very careful during that push. There is nothing as yet in the horizon to make anyone want to dump Gold, but when the bubble does burst (and one possible level lies around 2055), we will get a fairly aggressive move down to 1480. We shall see.

Credit: Ramki


NIFTY IS IN ITS MAJOR FIFTH


Nifty is in its Major 5th wave having completed its 4th wave in the week of 25.10.2002 and has now completed the sub wave 1 and in its corrective phase of "abc" from 2008. And the same is market in a small yellow circle in the above chart to understand the "Positioning of the market" in the current scenario. Where that "c"(of the (2)nd wave) will end and when the next sub waves 1 & 2 will unfold: A most likely pre-election.
An alternative scenario would be: The (2)nd wave completed at 2253 and the sub wave 1 comleted at 6339 and sub wave 2 is on.
Some of the sub waves would be more clear in "Day Charts".

Credit: Ilango