Friday, July 12, 2013

Nifty - The Sleeping Monster Route-Map

NIFTY LONG TERM
I believe this is a real candidate for the probable path Nifty will take, but my belief isn’t worth a dime. Still, it would be interesting to watch if it takes place like this or not.  A clue – my belief gets more strength from the long-term picture of USD-INR. But that’s the subject of my next post.


First and foremost, Neowave novices like me must know something about the 7-legged pattern called “Diametric”. In the words of the discoverer Glen Neely himself – 

These patterns began to appear in the early 90's as the market's way to adjust to the increasing popularity of wave theory (too many people were looking for the same things, so the market created new ways of behaving). 

They were the first patterns witnessed where most wave segments took about the same amount of time, with one or two of the waves consuming a little more (or little less) time than the others. 

 While most waves consume a similar amount of time, they do NOT consume a similar amount of price. A Diametric will possess an obvious expansionary or contractionary bias during the first four waves of the pattern; that bias will reverse during the second half of the formation. 

It is called "Diametric" because it combines two Triangular patterns, one initially “Contracting” up to the "d" leg, followed by an “Expanding” one. The contraction point is the "d" leg, and the legs on either sides of it tend to be equal.

Now let’s check the first part of the chart, the period of 1992 to 2001 & the time-similarity is unmistakable. Indeed, that is the first clue of recognizing the pattern.4 out of 7 legs, spread over a period of 9 years, take exactly the same amount of time. Intriguing!
To measure & compare price moves in a long-term scenario, it is advantageous to go to percentages. 


Let’s check it – 

NIFTY 1992 -2001
The similarities between A & G and B & F are so very obvious. Even C & E differ by a measly 4%.


Coming to the 2008 onwards scenario now, we find the time-similarity again, where 3 out of 4 legs (A, C & D) have taken nearly the same time.


Another very interesting thing – the total time taken for the first 4 legs (A to D) for both the instances are the same – 66-68 months.


Price-wise – 


NIFTY 2008- 2017
Going by the same property of a Diametric, we can expect this ongoing E to be equal of C or about 29% drop from the high of 6229, giving us a target of around 4400 (approx.) in the next 15-21 months.

The implication? The next year & half is going to be a grind, trying everyone’s patience, a virtual nightmare for traders and investors alike. Only very nimble-footed traders may survive. Trend-following strategies may under-perform for this period but could be back with a bang after this, whenever the F leg starts.
IF all these come true, then we are going to witness one of the finest rallies from the second half of 2014 or early 2015. This also matches nicely with the 8 year cycle, giving us a projected top at 2016. Then a vicious bear market which would precede the next mega-bull market. The final bottom could be anytime between 2017 & 2019.

The red channel can’t be overlooked. It contains the whole secular bull market. Irrespective of the Diametric scenario coming true or not, whenever Nifty touches the channel, expect a MAJOR multi-year move.


The median line of channel (thick green line) has worked nice & clean after 2001. A break of that line has always created a swift move, in any direction, since then. Currently it is at around 5300. Keep watch.


CREDIT: FIRE

Wednesday, August 22, 2012

S&P 500 SPX


http://elliottwavepredictions.com/wp-content/uploads/2012/08/SPX-weekly-8-20-124.pngHere is one of my alternate long-term Elliott Wave counts for the SPX that appears to be gaining in probabilty. As many of you know, I think the 90% U.S. stock market crash from 1929-1932 was a wave 2 at Supercyle degree. It only lasted 3 years. I’ve been thinking that Supercycle wave 3 ended in 2000, and that the 9-year expanded flat that followed (2000-2009) was a completed Supercycle wave 4. Alternatively, the above count projects that Supercycle wave 4 is still underway, and that the 2000-2009 expanded flat was just wave A of a larger sideways structure. I’ll have to admit that this count flows much easier than trying to force a 5-wave impulse onto the March 6 2009 though July 7 2011 period, as my main count does.

The count depicted above expects that primary (burgundy) wave W (ending Feb 18 2011) was a zigzag, and that primary (burgundy) wave X is in the process of carving out an expanded or running flat. Within that burgundy wave X, wave A black (ending September 22 2011) was an expanded flat, and wave B (black) of the flat is nearing completion as a relatively rare WXYXZ combination. If wave B black is 1.382 times the length wave A black was, the target for the top of this bull market would be 1432, which would be followed by a 5-wave impulse to the downside for wave C black and the end of burgundy X. Until wave B black has ended, an exact fibonacci target zone for the end of wave C black cannot be set. As an example though, if the SPX tops at 1432, the best target for the end of wave C black would be 1050, a 50% retracement of the March 2009 thru August/September 2012 structure. This 50% retracement target would have the S&P continuing to follow the 1968-1982 fractal, with the upcoming wave C black representing the 1976-1978 bear.

If this count is correct, wave B black will have lasted 1.618 times as long as wave A black did on September 5.

One slight problem with this count: If the movement since Sept 22 2011 is a WXYXZ, and that is the best way to count it in my opinion, it is a “mixed” combination, with wave W an expanded flat, Y a zigzag, and now Z another


CREDIT:  SID


Friday, July 13, 2012

SENSEX VIEWS


This chart was posted some time in Aug 2010  and it seems until now Sensex is following to the tee.  Will it  continue to do so ?


Credit:  tywo

Monday, February 20, 2012

NIFTY PERSPECTIVE

 See the monthly chart of Nifty Spot in ichimoku, Fib & Gann.

Nifty went into corrective mode from 2008 peak of Bull market and retraced just above 0.786 of Fibonacci Retracement. In the process of correction, it touched the cloud and advanced again further. 


Look at Gann Chart of 21 years. Nifty's correction just ended below 2 X 1 angle around 2250 in the year 2008.

Where Nifty right now placed ?

As per Gann methodology, if it closes above 5712 and when technical validation is completed, its headed to first target of 9320.

One finer point you will note, Nifty invariably bottoms out in monthly chart when stochastic oscillator (parameter 8 , 4, 3 ) gets into oversold and turns on upside. This you can notice in the Gann Chart.

Importantly, I observe many talk about Nifty's direction and targets without understanding its rhythemic move. Nifty as a broad market Index, doesn't break 3 months low so easily in an uptrend and if it does it, then market goes in for a big correction. In the same vein, when it crosses 3 months high after a substantial correction, then upmove is put in place. But aberration to 3 months breakout of high and low are minimal, which you can observe from charts.


Now lets combine all the tools and see if we could arrive at logical conclusion.


 Nifty is trading above ichimoku cloud and has made breakout of 3 months high with Stochastics of 8,4,3 is turningup from oversold region. All these are perfectly set for upmove.. but catch here is, from Gann methodology. Unless Nifty closes above 5712, there cannot be any substantial upmove. As market has already overrun on upside without a breather, probably could face stiff resistance between 5475 - 5575 which is again Gann level of resistance.

Once when Nifty closes above 5712 with technical validation in place, then Good days are ahead with a substantial move to 9320.

I have tried to explain you the advantage of using multiple tools to arrive for trading decisions than simply relying on a standalone methodology. 


CREDIT:  RameshRaja

Monday, December 5, 2011

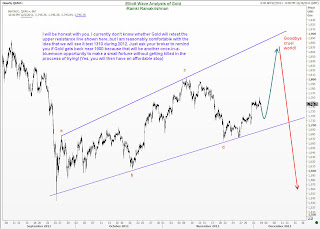
GOLD LONG TERM PERSPECTIVE

But beware of paying too much attention to the very short term charts! I have often warned you in this blog, (and if I remember correctly, also in my book “Five Wave to Financial Fortune”) that you can make decent money by trading the bigger waves. So what is my take in the bigger picture?
Elliott Wave analysis of the loger term Gold charts tells me that there is a reasonable chance for us to go dramatically lower, say to around 1310 during 2012. You should therefore start making plans to identify a good, low-risk selling level to capture that huge move (if and) when it happens. Of course, I hope to be around to give you my two cents worth at that time, but today’s Elliott Wave comments on Gold’s outlook is laying the foundation for that move. Just remember that you read it here first, and when others pick up the ideas and publish it, you know that they are also secret members of the Wave Times club!
Enjoy.

Credit:  RAMKI

Tuesday, October 25, 2011

GRAND SUPERCYCLES, SUPERCYCLES AND CYCLE WAVES

On wednesday, after a careful historical review, we posted the following:
Now that markets worldwide have declined anywhere from 22% (SPX/FTSE) to 43% (RTSI), we thought we would review the current market and place it into the proper historical perspective. In February 2010 we published this piece on the GSC: http://caldaro.wordpress.com/2010/02/14/grand-super-cycle-revisited%e2%80%8f/. We see no reason to change this view.

A quick recap. A multi-century Grand Supercycle topped in 1929 and ended with the Great depression and an 89% stock market collapse by 1932. After that a new multi-century GSC began. Each GSC bull market consists of five SuperCycle waves. The bull market SC’s are multi-decade events. The first of these SC bull markets ran from 1932-2007. This we labeled SC1. The two year bear market that followed, when the market lost over 55% of its value, we labeled SC2. At the March 2009, SPX 667 low, SuperCycle 3 began its multi-decade bull market. Notice the bear markets cycles take very little time to do major damage, i.e. 1929-1932 89% market loss, and 2007-2009 55% market loss.

Each SuperCycle bull market consists of five Cycle waves. During SC1, 1932-2007, the bull market Cycle waves lasted from five years (1932-1937) to 31 years (1942-1973) and 33 years (1974-2007). Notice the shortest was five years. Within each bull market Cycle wave there are five Primary waves. These Primary waves can last anywhere from two months (Jly32-Sept32) and five months (Feb33-July33), to 17 (1949-1966) and 18 years (1982-2000). You may already see where I’m heading with this.
When we review the 15 world market indices we track we find 9 have OEW confirmed bear markets, and the rest came close to confirming at the recent lows. The wave counts for their previous bull markets display seven with Primary wave I highs, followed by a Primary II bear market. The other eight display five wave structures, counted as a completed Cycle wave [1] into their bull market high, and then their bear markets. When we compare the historical bull market time relationships of Cycle waves (5 to 33 years) and Primary waves (2 months – 18 years), to these eight 2 year bull markets we find they are historically too short to be counted as completed Cycle waves. They look more like Primary waves. As a result of this analysis, all the world indices must have had a Primary wave I high to end their bull markets and then a Primary wave II bear market. We will be downgrading the current counts, by one degree, on all eight of these world indices. The ramifications of this “project, monitor, adjust” event will prove to be quite interesting. We will cover this at another time.
That time is now. As we continued our analysis, covering 1932-present, we reviewed all Primary waves for the entire period. What we found is quite interesting. Every rising Primary wave I or III, lasting from 5 months to 18 years in the study, was followed by a declining Primary wave II or IV of 1 year to 6 years. The shortest declining Primary wave, (July33-July34), followed the shorter rising Primary wave (Feb33-July33). Since our current Primary wave I lasted 26 months, we’re looking at a Primary wave II of at least 12 months.


 CREDIT:  caldaro

Tuesday, September 20, 2011

DOW JONES INDUSTRIAL


We are witnessing yet another recovery in this complex correction, and so a new key level emerges for our next directional trade. This comes at 11940. If we approach that level with diminishing volume, it makes sense to turn short there with a nearby stop. I still have not given up on the move to 9970 at this point in time.  See chart below:


Credit: Ramki